World Diabetes Day
World Diabetes Day aims to raise awareness of diabetes and encourage global action around this crucial health condition.
This year, researchers from Harvard’s Brigham and Women’s Hospital and Harvard’s T.H. Chan School of Public Health collaborated on a study update that evaluates the effects of physical activity and the menstrual cycle on glucose. The analyses use data from both the Apple Heart and Movement Study (AHMS) and the Apple Women’s Health Study (AWHS).
Diabetes
Worldwide, about 537 million adults are living with diabetes, a number projected to reach 643 million by 2030.1 In the United States, 2 in 5 people are expected to develop diabetes in their lifetime. Currently more than 1 in 3 adults in the U.S. have prediabetes marked by elevated glucose levels, not yet high enough to be classified as diabetes; yet only 19% of people with lab values in this range reported having been told they had prediabetes by a healthcare provider.2
Diabetes is a chronic condition characterized by elevated blood sugar (glucose). The most common forms of diabetes result from an inability to produce enough insulin (type 1 or T1D) or an inability to properly use insulin (type 2 or T2D). Symptoms of high glucose and diabetes may include frequent hunger, thirst, urination, and fatigue, as well as blurry vision, numbness or tingling in hands or feet, unexplained weight loss, and infections or wounds that take longer to heal. While both types of diabetes can occur at any age, T1D is more common in children and younger adults. Symptoms of T1D often develop over a short period of time and may also include nausea, vomiting and stomach pains. T2D is more common in adults but the prevalence in children is on the rise.3
Over time, elevated glucose levels can damage nerves and tissues throughout the body; directly and indirectly affecting smaller blood vessels in the eyes and kidneys and larger vessels that supply the heart and brain. Reducing exposure to high glucose through early detection of diabetes and intensive management of glucose, blood pressure, and cholesterol can reduce the risk and severity of many diabetes complications.4 With pregnancy there are additional risks to the developing fetus that can be reduced by limiting exposure to glucose elevations. For anyone diagnosed with gestational diabetes during pregnancy, there is an increased chance of developing diabetes in the future.
Monitoring Glucose
People with diabetes often strive to maintain glucose levels within the target range of 70-180 mg/dL and reduce exposure to low glucose, less than 70 mg/dL or elevated glucose, more than 180 mg/dL.5 While some factors affecting glucose can be modified, there are other unmodifiable factors that also affect glucose, such as illness and hormonal changes. Maintaining glucose within this range is a challenging balancing act, one that asks a lot of the person living with diabetes as it requires constant monitoring of glucose levels and adjusting activity, diet, and for some, medication, all while going about daily life.
Continuous glucose monitors (CGM) can empower people with diabetes to gain insight into how different foods, activities, and life stressors affect glucose. CGM devices measure glucose frequently, as often as every five minutes. When CGM data is supplemented with data from Apple Watch about activity, steps, sleep, and menstrual cycles it becomes a treasure-trove of information for people with diabetes, clinicians and researchers looking to better understand glucose and the effects of glucose on health and performance.
Glucose Analysis from AHMS & AWHS
These novel analyses from Apple’s Heart and Movement and Women’s Health Studies pairs CGM data contributed by participants through Health app with activity data from Apple Watch in AHMS and separately, with logged menstrual cycle data in AWHS. To ensure adequate glucose data, participants were included in the following analyses if they shared at least 100 days of CGM data, each with at least 100 glucose measurements per day, regardless of whether participants reported having diabetes.
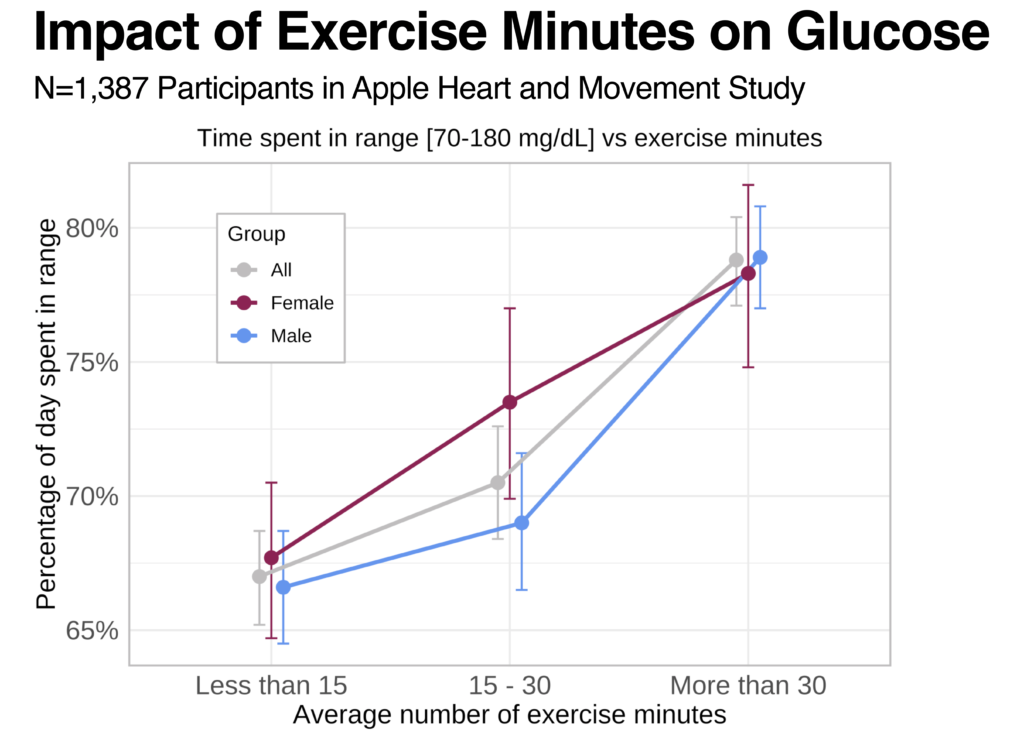
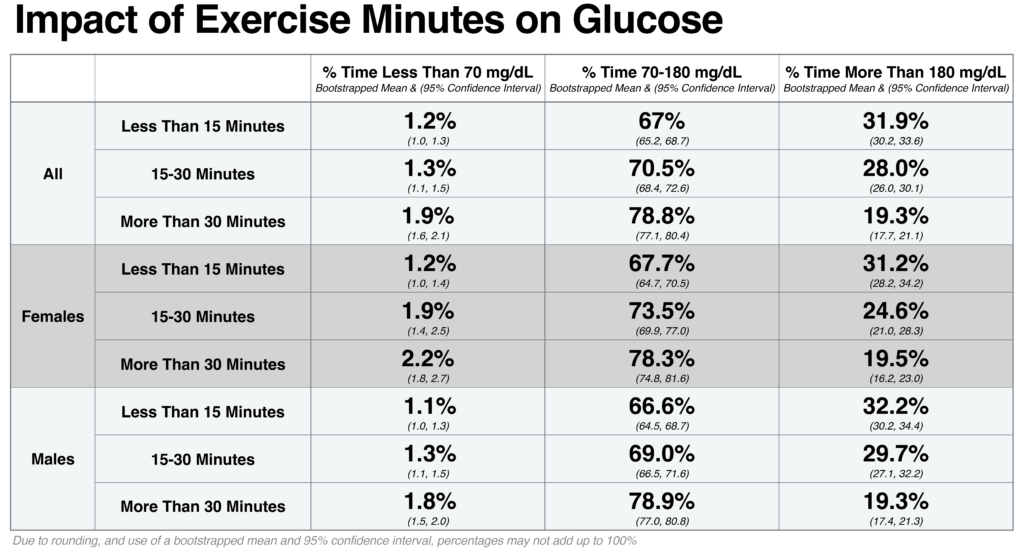
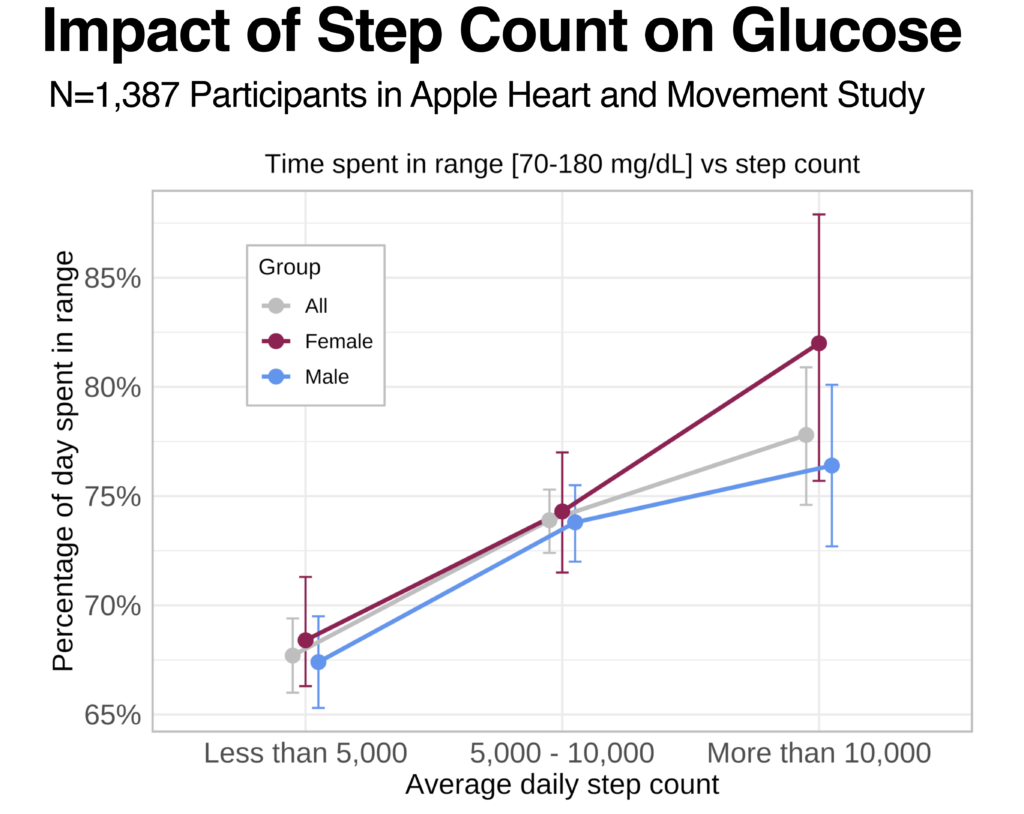
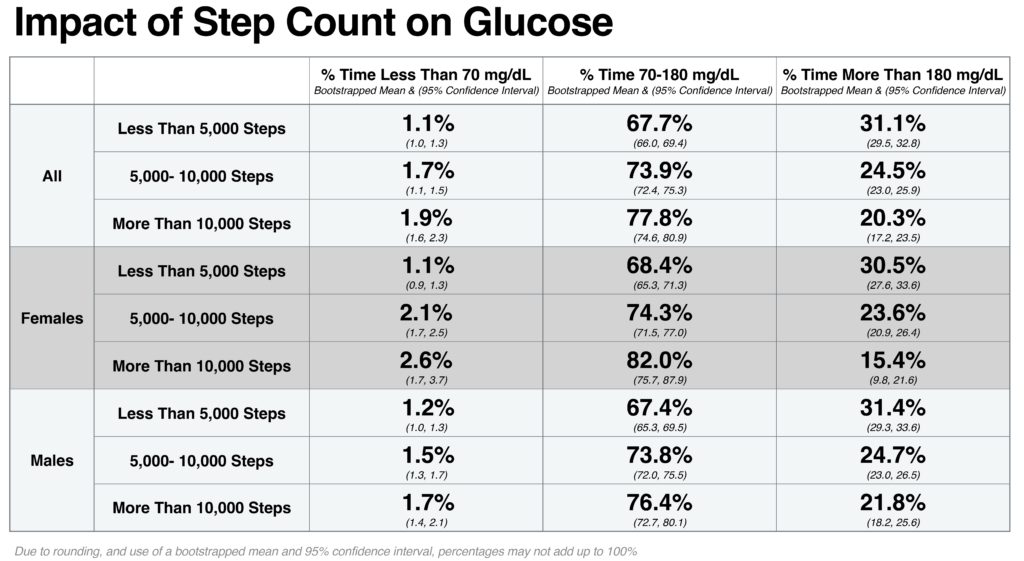
Does Activity Affect Glucose Levels?
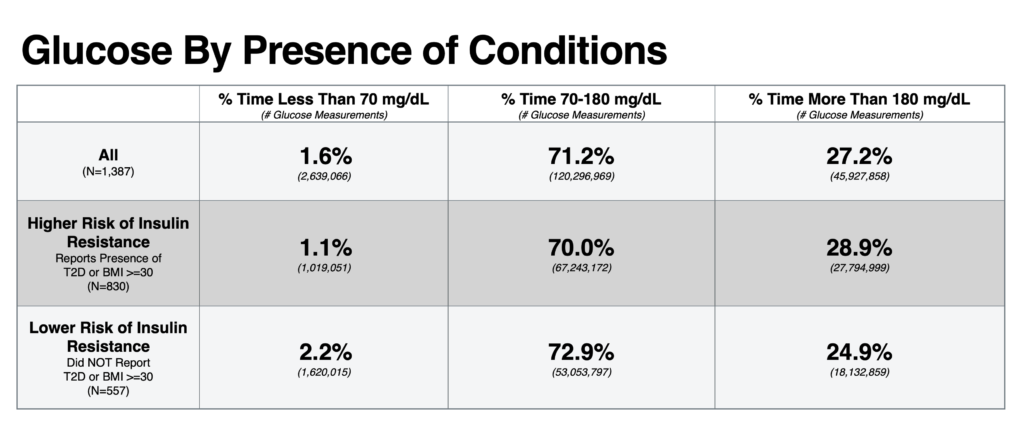
During and after exercise, insulin sensitivity often increases. Muscle cells increase glucose consumption which lowers glucose. In this analysis, we look at participants with CGM data and at least 50 days of data on exercise minutes and step counts from Apple Watch (N= 1,387 AHMS participants). As participants increased either the average duration of exercise or the average number of steps taken on a given day, we see a corresponding increase in the average percentage of time glucose fell within the target range of 70-180 mg/dL. Especially when medications that lower glucose are used, glucose can drop below range, or less than 70 mg/dL. As step count and exercise minutes increased, we also see a corresponding increase in percentage of time spent less than 70 mg/dL.
This data highlights the important role of physical activity in glucose management and the importance of monitoring for low glucose during and after exercise, especially when using glucose lowering medications. Participants who self-reported they had a condition associated with higher risk for insulin resistance such as T2D or body mass index of greater than or equal to 30 kg/m2 were observed to have a consistent trend of less time below 70 mg/dL, less time within the target range, and more time above 180 mg/dL when compared to participants not reporting either condition.
In addition to the short-term benefits of activity on glucose, regular activity also has longer term benefits including reduced risk for heart disease and sustained improvements in glucose control associated with increased muscle mass.6
Does the Menstrual Cycle Affect Glucose?
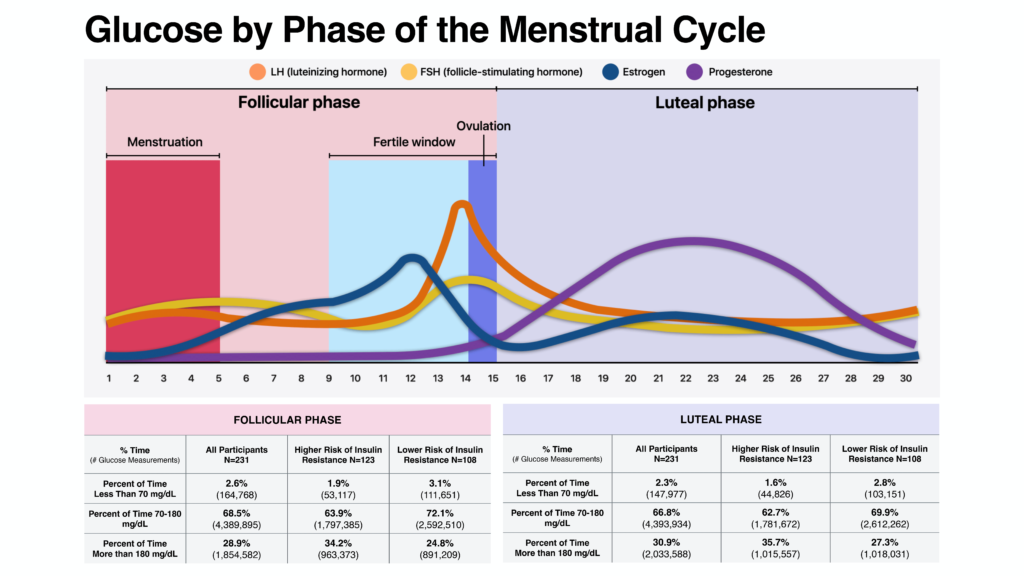
The menstrual cycle is regulated by many different hormones including estrogen and progesterone which have been linked to changes in glucose and insulin sensitivity.
The follicular phase of the menstrual cycle begins on the first day of period and is marked by an increase in estrogen which in some studies has been associated with lower glucose levels and increased insulin sensitivity.7
Ovulation occurs mid-cycle and is followed by the luteal phase during which progesterone levels typically rise while estrogen levels decline. Cyclic changes in blood glucose levels and insulin sensitivity have been reported throughout the menstrual cycle in women with T1D and in women without any form of diabetes.8-13 Some previous studies found more time above range during the luteal phase and below range during the follicular phase, while others reported no significant differences.10-14
CGM data were collected from 231 individuals who consented to participate in the AWHS. Data on menstrual cycles for participants were included in the analyses when there were at least 6 consecutive cycles reported and were excluded if hormone use was reported at any time during the cycle, such as use of hormonal contraception. Analyses of glucose levels across 1,982 menstrual cycles highlighted a slight increase in time spent within the target range during the follicular phase when progesterone levels are lower (68.5% of day) compared to the luteal phase (66.8% of day). Participants also spent slightly less time above range during the follicular phase (28.9%) when compared to the luteal phase (30.9%).
T2D is often associated with insulin resistance. Polycystic ovary syndrome (PCOS) and a body mass index greater than 30kg/m2 can also increase resistance to insulin and subsequently glucose levels. We analyzed a subset of participants with these conditions (N=123) and found less time within the range of 70-180 mg/dL during the follicular phase than participants who did not report these conditions 63.9% vs. 72.1%. This trend was also seen during the luteal phase 62.7% time in range vs. 69.9%.
T2D is often associated with insulin resistance; polycystic ovary syndrome (PCOS) and a body mass index greater than 30kg/m2 can also increase resistance to insulin and subsequently glucose levels. We analyzed a subset of participants with these conditions (N=123) and found less time within the range of 70-180 mg/dL during the luteal phase 64% vs. 72% and the luteal phase 63% vs. 70%.
Summary
As we observe World Diabetes Day 2023, we want to thank participants in the Apple Women’s Health Study and the Apple Heart and Movement Study for their participation in these large, remotely conducted research studies. Future analyses and research efforts can help us better understand the impact of additional factors such as intensity of activity, sleep, stress, and illness on glucose levels. To establish a causal relationship between glucose and activity or phases of the menstrual cycle, additional analyses that controls for factors that may confound the results such as age and other medical conditions is needed.
Early detection of diabetes and intensive glucose management can reduce the risk and severity of many complications. These analyses reinforce the potential benefits of physical activity on glucose and highlight some of the many challenges people living with diabetes face every day.
Get the app. Join the Study.
- International Diabetes Federation. World Diabetes Day Facts and Figures. https://worlddiabetesday.org/about/facts-figures/ accessed 28 Jul 2023.
- Centers for Disease Control (CDC). National Diabetes Statistics Report; https://www.cdc.gov/diabetes/data/statistics-report/index.html; accessed 28 Jul 2023.
- Centers for Disease Control (CDC). Diabetes Symptoms; https://www.cdc.gov/diabetes/basics/symptoms.html accessed 28 Jul 2023.
- Centers for Disease Control (CDC). Diabetes Report Card; https://www.cdc.gov/diabetes/library/reports/reportcard.html , accessed 28 JUL 2023.
- Battelino et al. Clinical targets for continuous glucose monitoring data interpretation: recommendations from the international consensus on time in range. Diabetes Care 2019; 42:1593–1603.
- Center for Disease Control: Diabetes and Your Heart. https://www.cdc.gov/diabetes/library/features/diabetes-and-heart.html#:~:text=People%20with%20diabetes%20are%20also,your%20risk%20for%20heart%20disease. Accessed 27 Oct 2023.
- Mauvais-Jarvis F., Clegg D.J., Hevener A.L. The role of estrogens in control of energy balance and glucose homeostasis. Endocrine Reviews. 2013; 34:309–338. doi: 10.1210/er.2012-1055.
- Goldner W.S., Kraus V.L., Sivitz W.I., Hunter S.K., Dillon J.S. Cyclic changes in glycemia assessed by continuous glucose monitoring system during multiple complete menstrual cycles in women with type 1 diabetes. Diabetes Technol. Ther. 2004; 6:473–480. doi: 10.1089/1520915041705875.
- Barata D.S., Adan L.F., Netto E.M., Ramalho A.C. The effect of the menstrual cycle on glucose control in women with type 1 diabetes evaluated using a continuous glucose monitoring system. Diabetes Care. 2013; 36: e70. doi: 10.2337/dc12-2248.
- Trout K.K., Rickels M.R., Schutta M.H., Petrova M., Freeman E.W., Tkacs N.C., Teff K.L. Menstrual cycle effects on insulin sensitivity in women with type 1 diabetes: A pilot study. Diabetes Technol. Ther. 2007; 9:176–182. doi: 10.1089/dia.2006.0004.
- Brown S.A., Jiang B., McElwee-Malloy M., Wakeman C., Breton M.D. Fluctuations of hyperglycemia and insulin sensitivity are linked to menstrual cycle phases in women with T1D. Diabetes Sci. Technol. 2015; 9:1192–1199. doi: 10.1177/1932296815608400.
- Herranz L., Saez-de-Ibarra L., Hillman N., Gaspar R., Pallardo L.F. Glycemic changes during menstrual cycles in women with type 1 diabetes. Clin. 2016; 146:287–291. doi: 10.1016/j.medcli.2015.11.044.
- Yeung E.H., Zhang C., Mumford S.L., Ye A., Trevisan M., Chen L., Browne R.W., Wactawski-Wende J., Schisterman E.F. Longitudinal study of insulin resistance and sex hormones over the menstrual cycle: The BioCycle Study. Clin. Endocrinol. Metab. 2010; 95:5435–5442. doi: 10.1210/jc.2010-0702.
- Levy C.J., O’Malley G., Raghinaru D., Kudva Y.C., Laffel L.M., Pinsker J.E., Lum J.W., Brown S.A. Insulin delivery and glucose variability throughout the menstrual cycle on closed loop control for women with type 1 diabetes. Diabetes Technol. Ther. 2022; 24:357–361. doi: 10.1089/dia.2021.0431.