
Based in Boston at Brigham and Women’s Hospital, the Apple Heart and Movement Study researchers feel the city buzzing with spring energy as a significant day draws near – Patriots’ Day. Celebrated on the third Monday of April, it’s a state holiday for Massachusetts that commemorates pivotal battles from the American Revolutionary War. Key to the celebrations is the annual Boston Marathon. Runners, spectators, and enthusiasts from around the globe converge on Boston and its surrounding areas to partake in this iconic event, making it one of New England’s most anticipated sporting events.
In this update, we analyzed walking and running workouts recorded throughout the study to share insights on just how far our participants are moving and what training and cardio fitness look like for those who have reached that marathon (26.2 miles) milestone.
Going Any Distance:
To get an overall look into who has endurance in mind, our team identified the longest distance recorded in a single walking or running workout for each study participant.
Since the Apple Heart and Movement Study’s launch in November 2019 through January 1st, 2024, there have been over 197,700 participants who recorded at least one walking workout and about 99,400 with at least one running workout. Over 50% of participants who recorded either exercise achieved a 5k (5.0 kilometers = 3.1 miles) distance or more at least once in each respective category.
For people new to running, the 5k is a popular distance to work up to, with more and more races geared towards charity, inclusivity, and general health and wellness. It is a great distance for novice runners and those interested in building up faster speeds alike, without heavy endurance training needed to cross the finish line.

Figure 1. This bar chart demonstrates the number of participants for each category, running or walking, by the longest distance logged in a single workout. Participants are represented twice if they recorded both types of workouts. Combined, 201,471 participants completed at least one walking workout and/or at least one running workout. For ease in categorizing distances in the middle of the chart, 5k represents distances from 5k to <10k (6.2 miles) and so on. The data presented in this chart is viewable in Table 1 and Table 2.
Figure 1 demonstrates that the percentage of Apple Heart and Movement Study participants sharply declines with increasing distance, with only 1.7% (N=1,725) of runners completing a marathon and 0.1% (N=253) of walkers. Demographic details for each group based on their longest distance recorded can be found in Table 1 (runners) and Table 2 (walkers) on the supplemental data page. We found that the percentage of participants with a BMI between 18.5 and 24.9 increases as distance increases. We also see that the 35-44 age group has the largest participation rate in the marathon or longer, with 2.1% (N=585) of the 27,521 runners in that age range achieving the 26.2 mile mark (or longer) during the study period.
Building up to a Marathon:
While running or walking a marathon in a single period may seem unachievable to many, consistent physical activity is a great goal to have overall. One question our team asked was if all the running and walking workouts were to be added up in a given period, how long would it take Apple Heart and Movement Study participants to reach the 26.2-mile marker? We did this for last year’s Boston Marathon month, April 2023.
A total of 76,114 participants in April 2023 logged at least one walk or running workout. Within the month, 17,376 (22.8%) participants recorded a summed distance of 26.2 or more miles. In addition, we estimated the number of days it would take each of the 76,114 participants to complete a marathon based on the frequency of walks or runs and the distance they traveled that month.
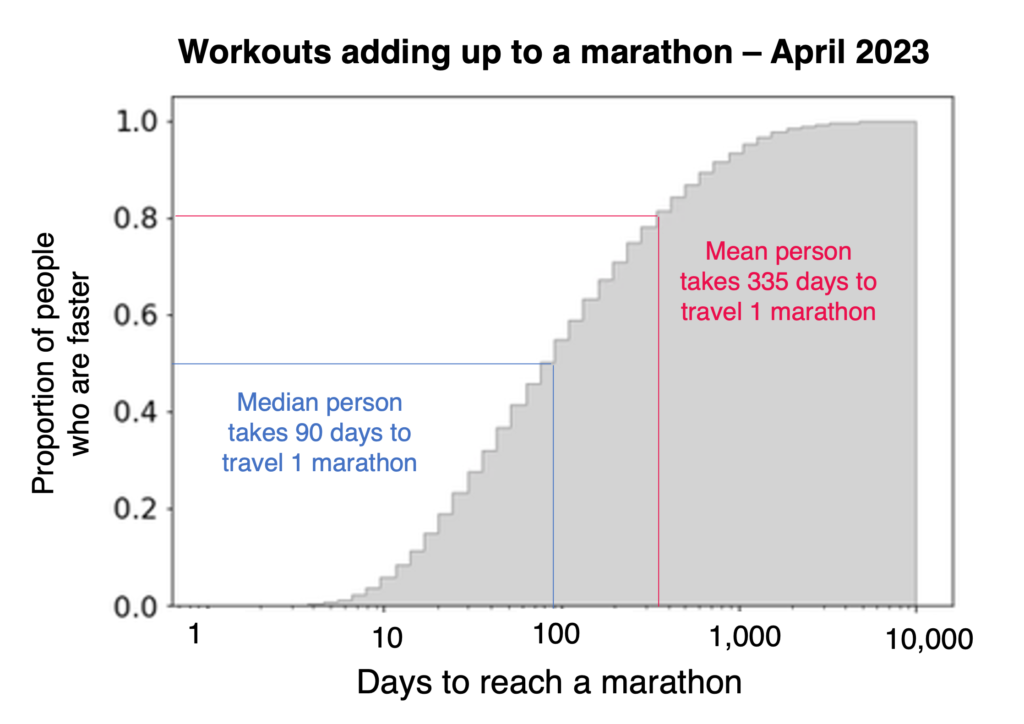
Figure 2. Cumulative histogram of marathon completion times across all of April 2023. Given the number of miles a person walked or ran in April 2023 and the number of days they were enrolled in AH&MS that month, this figure shows how many days it would take them to log 26.2 miles in walking and running workouts. Participants who log many miles per month are on the left end of the distribution.
Figure 2 demonstrates the range of this approximated speed among our participants. Based on April’s data, half of our participants would walk and/or run 26.2 miles in 90 days or fewer. The average speed is a bit slower, 334 days per marathon – due to a long tail of participants who infrequently log a run or walk. Note that our method may tend to underestimate true distance traveled because we only consider walks or runs that were part of a workout logged and shared with AH&MS. Apple Watch can automatically detect a run or walk, but not all participants configure their Apple Watch to do this.
While we did not look at step count in this update, another common approximation based on average stride length is roughly 2,000 steps per 1 mile, with a marathon resulting in about 52,400 steps! We invite all participants to look at their distance statistics throughout the month and celebrate long-distance wins, even if it is not accomplished on a single day.
Insights from Marathon Runners:
To define a marathon in a single day in the Apple Heart and Movement Study, we set a threshold of the total distance recorded between 26.05 and 26.90 miles for any single running workout logged. This led to 1,507 participants running 2,623 marathons in total.
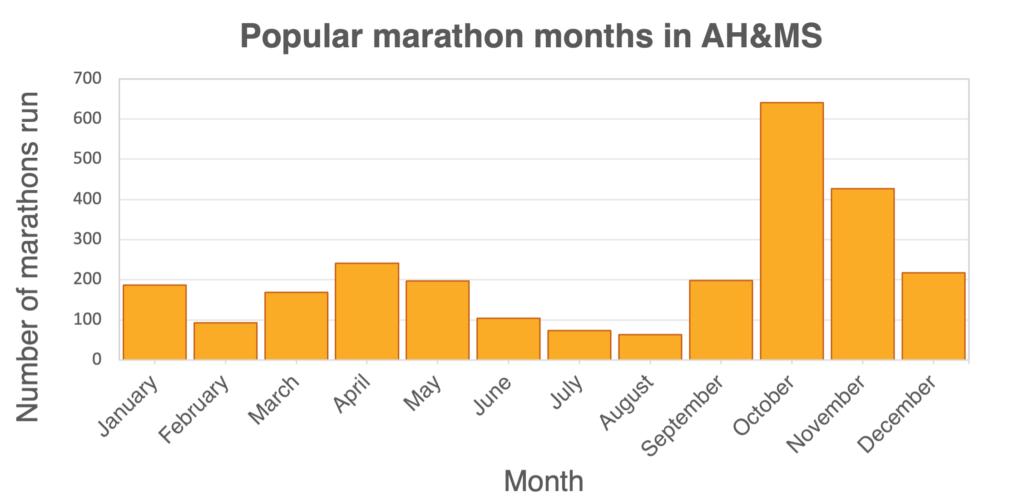
What was the most popular month for marathon running amongst participants? Figure 3 shows the monthly counts of marathon-length running workouts, aggregated across over four years of data, and October was the clear favorite, with 641 marathons recorded since the study launch. We also found that for each month in any year, there have been at least five marathon-length running workouts, even during the peak of the COVID pandemic. Table 4 in the supplemental data shows monthly data for each year.
How did our cohort train? Typically, training for a marathon involves months of preparation that includes a gradual increase in mileage to build endurance and stamina, causing physiological changes in the body.[1] While it’s most common to have at least four months of training leading up to a marathon distance, we looked at the three months leading up to it to limit possible overlap in the build-up of training for other events.
We saw a large variation in training strategies, but a few patterns emerged. It’s standard practice to build up gradually in miles and “taper” in the last month to ensure your body is well-rested for the big day. After a marathon, rest and recovery are recommended, so runners are encouraged to have a very light week following. Figure 4 below demonstrates tapering three to four weeks from the big day and a steep decline post-marathon. The trend lines are grouped by the top, middle, and bottom 10% of finishing times, with the average weekly distance logged for each group plotted. The top 10% ran roughly 16 miles more per week than the middle 10% leading up to marathon day.
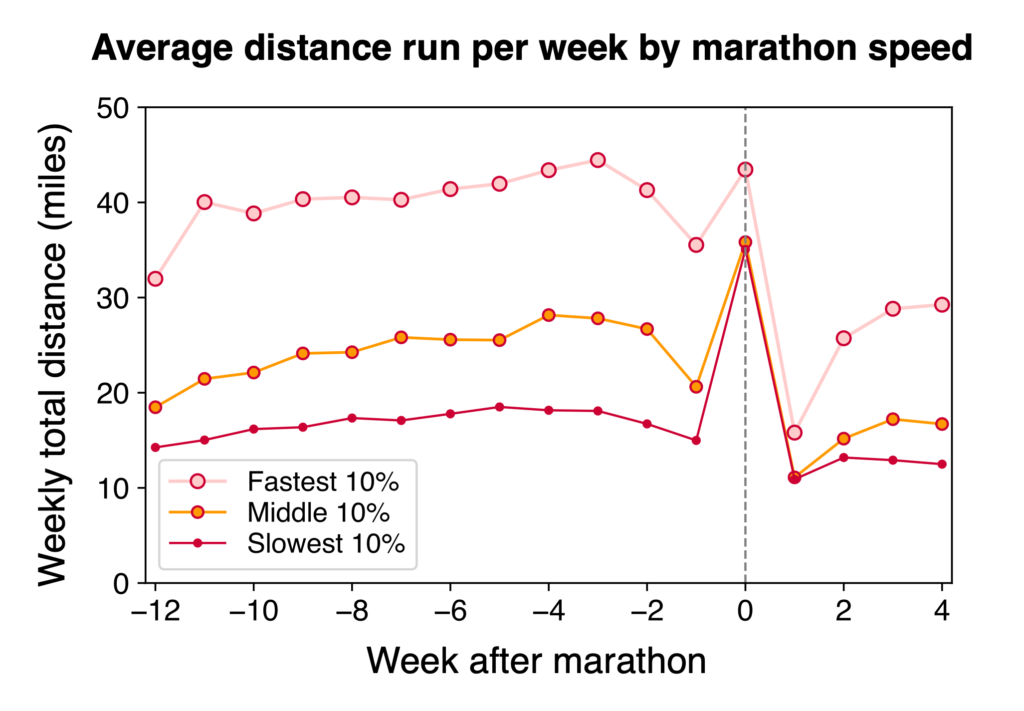
Figure 4. Weekly average running distance, grouped by race time: the top 10% of runners (3 hr 27 min or less); middle 10% (4 hr 31 min to 4 hr 46 min); and bottom 10% (6 hr 5 min or more). The data presented in this chart is viewable in Table 5.
To illustrate how people’s fitness evolves when training for a marathon, we can plot their VO2 max measurements versus the amount of time left before the marathon. However, because the variation between people is much larger than the variation within a single person’s VO2 max history, it can be challenging to see what’s going on if we look at all our runners together.
One way of visualizing changes over time across this entire cohort is to use a kind of “relative fitness,” which, in this analysis, is a person’s VO2 max as a fraction of their VO2 max on race day. When we do this, as demonstrated in Figure 5, and average across all marathoners in a given week, our average runner’s relative fitness is near 1.0 near race day but tends to be about 1% lower a few weeks before and after the marathon.
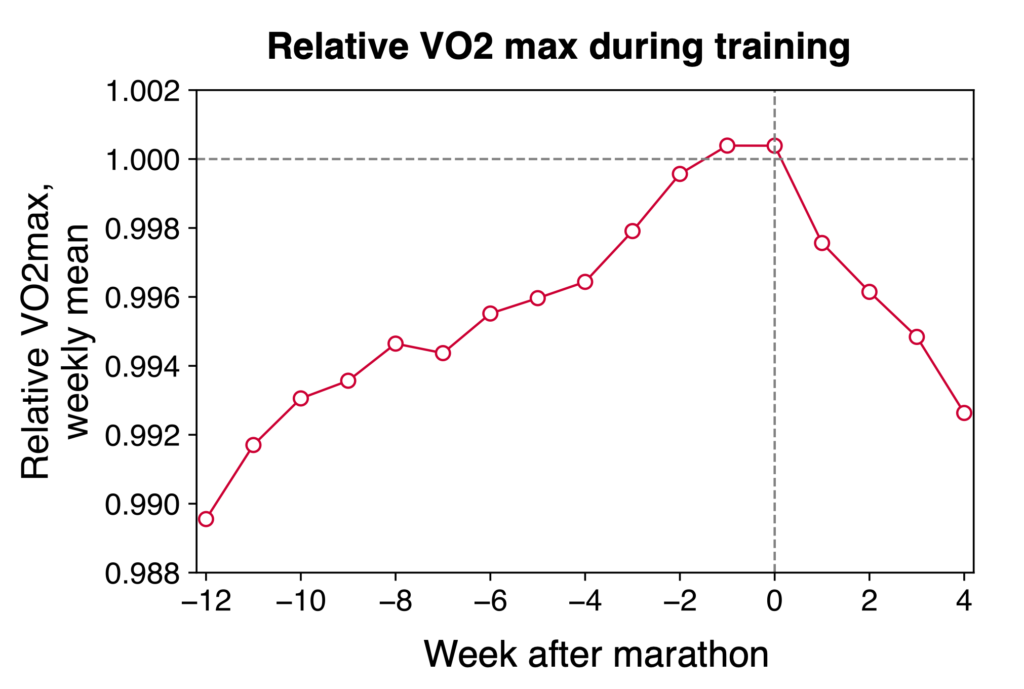
Figure 5. Changes in cardiorespiratory fitness in the weeks before and after a marathon. VO2 max changes preceding and following a marathon, averaged across 1,272 runners, using each runner’s fastest marathon. Each weekly data point is the average across all runner’s personal weekly averages. The relative VO2 max change is minimal at this aggregated level due to high participant variation.
This trajectory of VO2 max over time closely reflects the training trajectories in Figure 4: averaged across many people, a progressively more challenging training program is associated with increases in VO2 max; relaxing that training is associated with declines in VO2 max. However, our averaging procedure hides a great deal of variation among individuals, both in their exercise trajectories and in their VO2 max trajectories.
When looking at an individual level, 43.2% (N = 550) of marathon runners had a positive and statistically significant change when comparing average VO2 max values in the first 15 days and last 15 days of the training period studied. See Table 6 for more details on the distribution of changes.
Moving Forward:
Whether taking a leisurely stroll or training for a marathon, physical activity like walking or running can offer countless benefits for both physical and mental well-being.[2,3,4]
So, lace up your shoes, hit the pavement or trails, and embrace the power of every step. Remember, it’s not about how fast or far you go—it’s about taking that first step and staying consistent on your health journey. As the Boston Marathon approaches, let’s celebrate the spirit of running, one step at a time.
Why We Run: Apple Heart and Movement Study Team Members
To help celebrate, we wanted to share what some of our “runner” team members say about the joys of running and the Apple Heart and Movement Study!

Kat Cyr
BWH – Data Scientist
Over the past year, my dog, Winnie, has inspired me to enjoy running for the first time. To accommodate her exercise needs and my busy schedule, our daily walks have gradually sped up to running quicker miles. Since I started running, I’ve noticed that my cardio fitness has increased, and I’m sleeping better. As a data scientist on the BWH team, it is really exciting to study a large population with these types of data to see real-life exercise patterns and how they relate to changes in individuals’ cardiac health.

Angela Spillane
BWH – Project Manager
In 2021, I returned to running while prepping for my first marathon. I spent a lot of time learning about the recommended training methods and found that slowing down for many of my runs was key for injury prevention and avoiding burnout. Now, I really enjoy going for relaxed jogs. I often stop to take in the sights and, of course, to smell the flowers! At Brigham and Women’s Hospital (BWH), I’m the Apple Heart and Movement Study project manager. I love that this project allows individuals to share data they’re already collecting (like these walking and running workouts) to help contribute to our understanding of physical activity and health as a whole.
The Apple Heart and Movement team thanks its participants for their continued contributions to this exciting research and hope you enjoy these study insights as we expand our understanding of physical activity and health.
Get the app. Join the Study.
[1] Egan, Brendan, and Juleen R Zierath. “Exercise metabolism and the molecular regulation of skeletal muscle adaptation.” Cell metabolism vol. 17,2 (2013): 162-84. doi:10.1016/j.cmet.2012.12.012
[2] Ahmadi MN, Rezende LFM, Ferrari G, et al. Do the associations of daily steps with mortality and incident cardiovascular disease differ by sedentary time levels? A device-based cohort study. British Journal of Sports Medicine 2024;58:261-268.
[3] Smith, Patrick J, and Rhonda M Merwin. “The Role of Exercise in Management of Mental Health Disorders: An Integrative Review.” Annual review of medicine vol. 72 (2021): 45-62. doi:10.1146/annurev-med-060619-022943
[4] Perry, Andrew S et al. “Physical Activity Over the Lifecourse and Cardiovascular Disease.” Circulation research vol. 132,12 (2023): 1725-1740. doi:10.1161/CIRCRESAHA.123.322121
First photo featured: iStock.com/ZamoraA